Showing posts with label tsunami. Show all posts

Monday, November 4, 2013

Why Fukushima's Reactors Failed

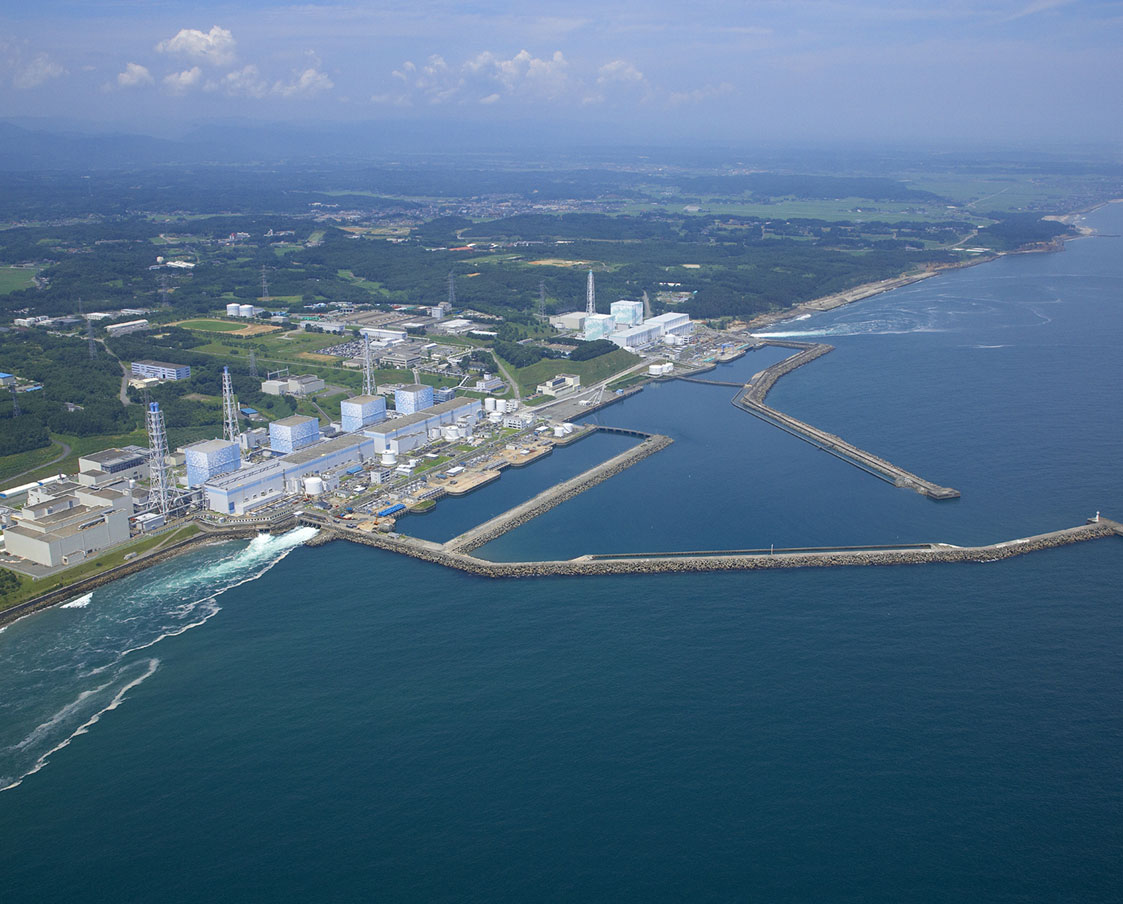
Bird's eye view of Fukushima Daiichi Nuclear Power Station before the earthquake and tsunami on Fri. Mar. 11, 2011. Units 1 (right) to 4 (left) are seen in the foreground and 5 (left) and 6 (right) further back. Units 1, 2 and 3 incurred fuel meltdowns (source: TEPCO).

Three of the six reactors at Fukushima Daiichi Nuclear Power Station 120 miles north of Tokyo on Honshu's east coast incurred nuclear fuel meltdowns after the 2011 Tōhoku Earthquake and Tsunami. One reactor had been defueled for inspection. The station's two other reactors could be shutdown safely.
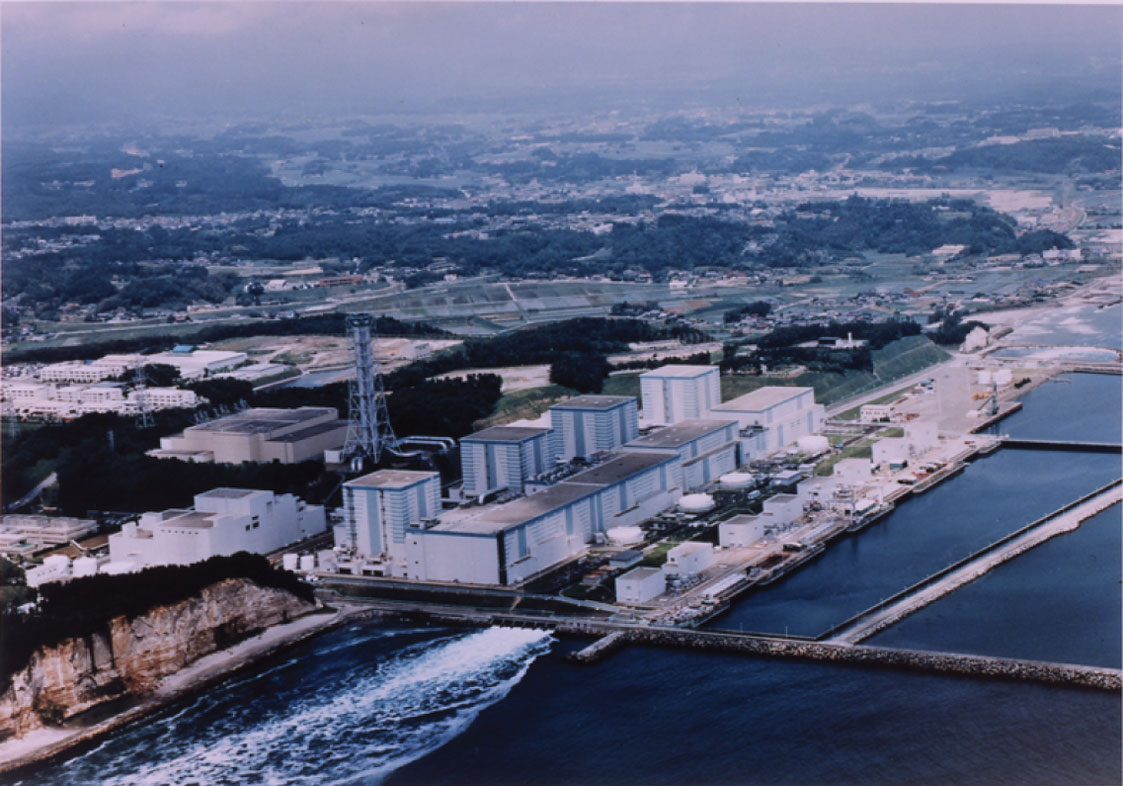
Bird's eye view of Fukushima Daini Nuclear Power Station before the earthquake and tsunami on Fri. Mar. 11, 2011 (unit 1 is on the right). All units could be safely shutdown. (source: TEPCO).

The four operating reactors at Fukushima Daini Nuclear Power Station seven miles away could also be saved.

The meltdowns at Daiichi led to powerful hydrogen explosions, releasing amounts of radioactive material over land and sea only rivaled by the 1986 Chernobyl reactor disaster in the Ukraine. The government imposed an exclusion zone around the stricken station, because radiation doses were deemed too high for habitation. To date, roughly 70,000 former residents cannot return home permanently. According to Shigeru Sato, Tsuyoshi Inajima, Monami Yui and Emi Urabe's report with the title "Japan Mulls Plan for One Operator to Run All Reactors: Energy" published by Bloomberg Oct. 22, 2013, cleanup and compensation are currently projected to cost 112 billion dollars, roughly equaling the cost for two Hurricane Sandies.

A multitude of inquiries have attempted to uncover the causes underlying the Fukushima accident. The operator of both power stations, Tokyo Electric Power Company, tells us what happened in its accident reports. The company's fact compilation points to one essential lynchpin: the residual heat removal system must not fail.

The reactors at Daiichi and Daini are boiling water reactors with General Electric's Mark I or Mark II primary containment systems.
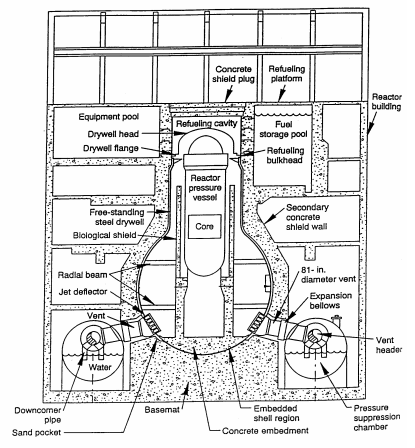
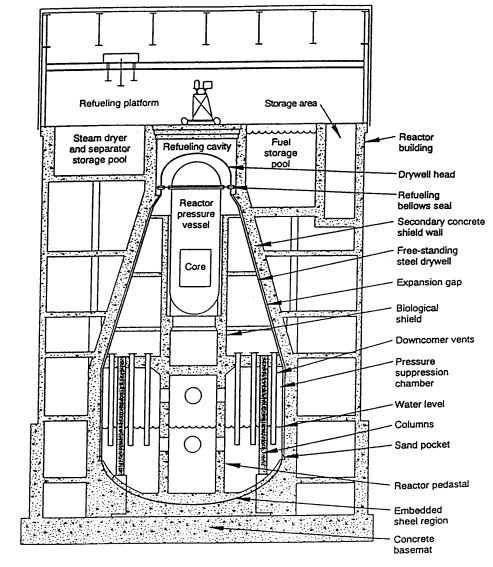
Schematic of a boiling water reactor with a Mark I containment(source: IAEA).
The Mark I containments consist of a pear-shaped drywell housing the reactor pressure vessel and a doughnut-shaped wetwell, also known as torus or pressure suppression chamber, holding a large pool of water. The drywell is connected at the bottom to the wetwell with equally spaced radial vent pipes.

Schematic of a boiling water reactor with a Mark II containment(source: IAEA).
The Mark II containments are shaped differently, but still consist of a drywell with the reactor vessel and a wetwell with a pressure suppression pool.

When nuclear reactors need shutdown in an emergency, control and safety rods are inserted between the fuel rods in milliseconds, disrupting the nuclear chain reaction. Furthermore, the reactor pressure vessel's main steam lines may be isolated from the power-generating turbine and main condenser when potential damage to the pipes is anticipated. Without heat transfer, decay heat builds in the reactor pressure vessel, revving up pressure. Water must be injected into the vessel as coolant and to keep the fuel covered to prevent a meltdown.

Though emergency pumps can inject water into the vessel at high pressure, the pressure must be relieved to prevent damage to the vessel and to facilitate greater coolant injection. Safety relief valves are periodically opened to depressurize the vessel. The valves discharge high-pressure steam into the wetwell's pool, in which the steam is condensed and the pressure is absorbed. If the vessel was breached and high pressure steam bursted into the drywell, the pressure would be relieved into the suppression pool through the pipes that directly connect the drywell to the wetwell.

At Fukushima Daiichi Nuclear Power Station, the quake vibrations tripped the operating reactors automatically. Control and safety rods were inserted and the pressure vessels were isolated. Access to outside power was lost because of quake damage. Emergency diesel generators started up to provide power.

About 40 minutes later, tsunami waves flooded power distribution panels and emergency generators located low in the reactor turbine buildings. Battery banks continued to power emergency core cooling systems. Except for Unit 1 which is equipped with a isolation condenser, two reactor steam-driven pumps, the reactor core isolation cooling system and the high pressure coolant injection system, were available to inject water into the reactor pressure vessels, initially from storage tanks and later from the wetwell pools, while the operators attempted to depressurize the reactors, relieving steam into the pools.

  • Eyewitness account of a Daiichi operator:
    “We went into the field in order to open the vent valves. When we were at the near the torus (that is, the wetwell, ed.) room, we heard a large, weird popping sound. The valve is at up high, so I put my foot on the torus to lift myself up. Then, my black rubber boot was melted like butter [source: TEPCO interim report, Dec 2, 2011, page 53].”
  • "The decomposition of the rubber-sulphur compound (that is, vulcanized rubber, ed.) takes place to an appreciable extent at the usual temperatures of vulcanization [source: Bureau of Standards Journal of Research, Volume 4 (1930), page 512]."
  • "A typical vulcanization temperature for a passenger tire is 10 minutes at 170 °C [source: Vulcanization]."

However, once the pool temperature exceeds 100 °C, absorption of reactor pressure becomes progressively less effective. The steam-driven pumps sucking water from the pool stop working above that temperature. Therefore, removing heat from the wetwell pool is absolutely necessary.
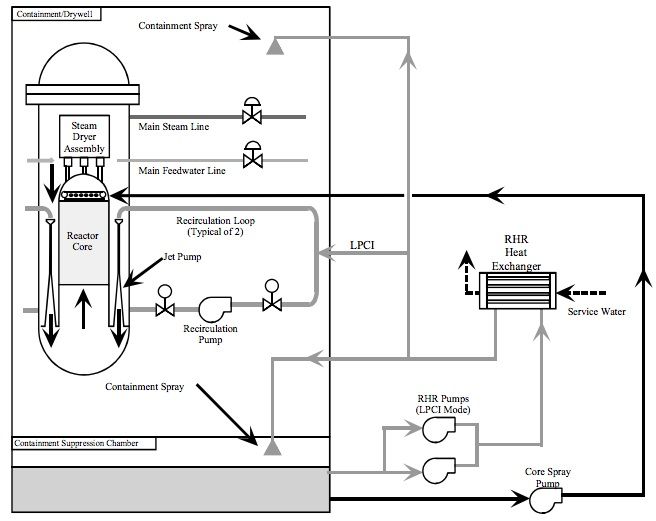
Schematic showing the residual heat removal system on the right (source: NRC).
The residual heat removal system fulfills this function. It consists of electric motor-driven pumps that flush cold service water from a large body of water, known as ultimate heat sink, through heat exchangers, cooling the wetwell pool. In Fukushima, the ocean is the ultimate heat sink, and the seawater pumps of the residual heat removal system were built near the water’s edge 4 meters above sea level.
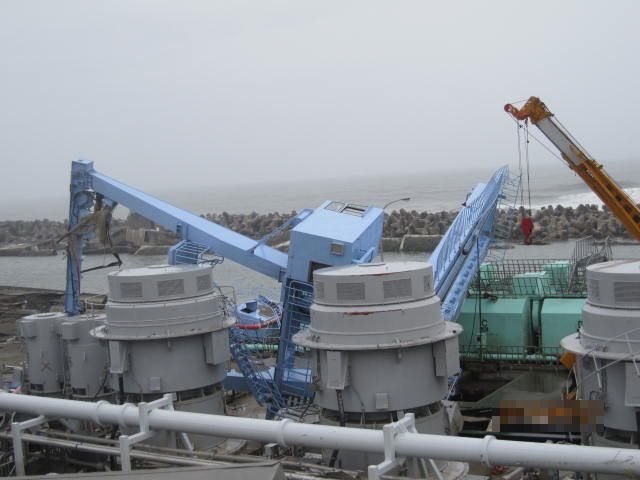
Exposed seawater pumps at Fukushima Daiichi Nuclear Power Station 2011 (source: Daisuke Tsuda). 
At Daiichi the pumps stood exposed on the dock and the tsunami rendered them irreparable, except one that could be re-powered and jury-rigged to supply units 5 and 6.

By contrast, at Daini the pumps were housed in buildings that can be seen dockside in the areal view above. The structures were not flood resistant, but withstood the brunt of the debris-laden waves. The pump for unit 3 persevered without loss of function, and the others could be repaired before the reactor fuel was uncovered. All reactors at both power stations with functioning residual heat removal systems could be shutdown safely within days.

Therefore, electric power must be available and the residual heat removal system must remain operable for nuclear reactors of the Fukushima type to successfully complete an emergency shutdown. These conditions impose a major constraint on accident recovery, representing a fundamental weakness of the reactor design. The residual heat removal system must remain operable under the conditions of flooding and station blackout.

Thirty reactors of this type currently operate in the United States. A number are sited in flood-prone areas. A moratorium should be imposed on these reactors, until the operators can ascertain that service water pumps are protected against inundation, debris, and loss of power.

Related Posts

Monday, June 11, 2012

Radiological Emergency Plan: North Anna Nuclear Power Station

On March 11, 2011, the Tōhoku-Chihou-Taiheiyou-Oki Earthquake and Tsunami struck Japan's northeastern coast with devastating consequences. Roughly 20,000 people perished that day. In addition, three reactors at the Fukushima Dai-ichi Nuclear Power Station (NPS) incurred fuel meltdowns with massive releases of radioactive material into the air and the ocean, contaminating large swaths of land. Roughly 80,000 residents had to be evacuated from the vicinity of the NPS and have not been able to return home.

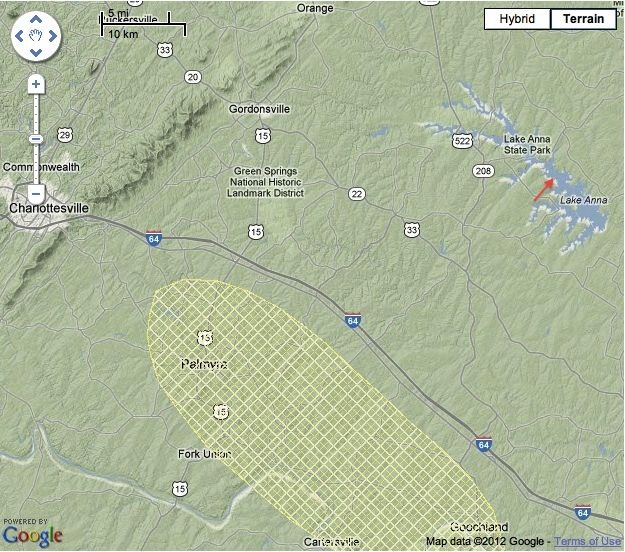
About five months later, the August 23 Virginia Earthquake precipitated the emergency shutdown of the two pressurized light water reactors at North Anna Nuclear Power Station (NPS) roughly 35 miles from my home. According to the U.S. Geological Service, the station is located at a distance of only 8 miles from the quake's epicenter and 20 miles from a quaternary fault zone. Seismologist Dr. James Martin of Virginia Tech. gave a comprehensive interview on the quake to Beverly Amsler aired on WVTF Radio IQ's Evening Edition for Nov. 22, 2011. The events made me wonder what a radiological emergency similar to that in Japan would entail in the U.S.

Area of quaternary faults and liquefaction in less than 15,000 years (hatched; source: USGS). The arrow points at the location of North Anna NPS. The epicenter of last Summer's Virginia quake was located near the junction between state routes 22 and 208.

When a utility company applies to the U.S. Nuclear Regulatory Commission (NRC) for the license to build a nuclear power reactor, an emergency plan for the eventuality of a radiological accident must be submitted. The plan must conform to federal regulations (10 CFR § 50.47 Emergency Plans). Dominion, the operator of North Anna NPS, is planning to construct a third unit on the station's premises and has hence developed such plan.

Examining Dominion's "North Anna 3 Combined License Application, Part 5: Emergency Plan, Revision 0 November 2007", reveals that much of the responsibility for the immediate decisions to be taken in the course of a severe reactor accident rests with the station operator, that is, primarily on the shoulders of the station's Emergency Coordinator (page II-1 of the proposed emergency plan). This person is instructed to collect information about the radioactive contamination monitored in the surroundings of the station, estimate the source term, that is the amount of radioactivity released from the failed reactor, determine the prevailing winds and precipitation, dispersing the radioactive matter, and constantly keep the relevant local, state and federal agencies up to date about the evolution of the accident.

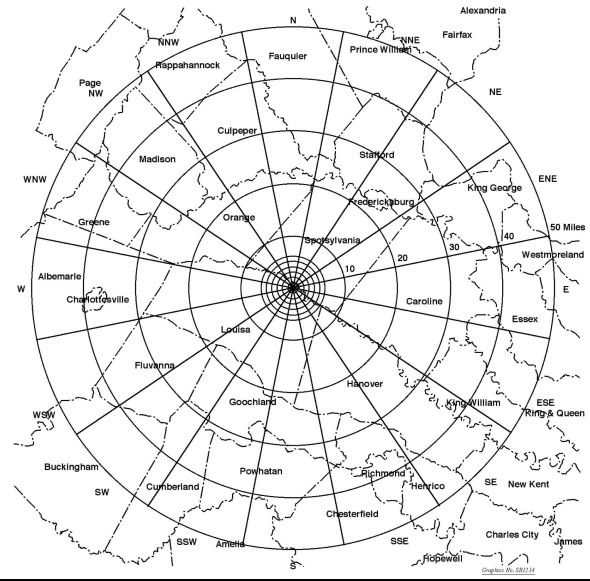
Map showing county lines and distance radii of Emergency Planning Zones proposed for North Anna NPS Unit 3 (source: Fig. I-2; Dominion).

Precise recommendations to the public depend on the source term and the progression of the plume in which the radioactivity is dispersed. The anticipated immediate protection measures are contingent mainly upon the distance from the power station. Radii of action are drawn (see drawing above). In addition to the protection of station personel (site emergency), the greatest concern lies with the safety of residents living within a 10-mile radius around the station, for whom precise instructions for health protection, evacuation and shelter have been planned (general emergency). This area is designated as the Plume Exposure Pathway Emergency Planning Zone. Radio stations periodically test emergency alert announcements (texts and further details can be found in the Commonwealth of Virginia Emergency Alert System Plan). Sirens alert residents to tune into local radio and TV stations for detailed announcements. Residents living within the 2 mile perimeter around the stricken NPS and within 5 miles straight downwind, including a margin on both sides (keyhole pattern), will be asked to evacuate immediately. Other residents within the 10-mile perimeter will be asked to stay indoors (NRC Backgrounder on Emergency Preparedness at Nuclear Power Plants).

The plans for residents beyond 10 miles depend on the amount and the duration of the release of radioactive matter from the reactor. The 50-mile radius encompasses the largest territory taken into consideration in the station's emergency plan. This area is designated as the Ingestion Exposure Pathway Emergency Planning Zone. Dominion set up a series of monitoring stations around the station. Near-real time ionizing radiation measurements available to the public within 100 miles from North Anna NPS, are disseminated by only two Radnet stations: one in Richmond and one in Harrisonburg, Virginia.

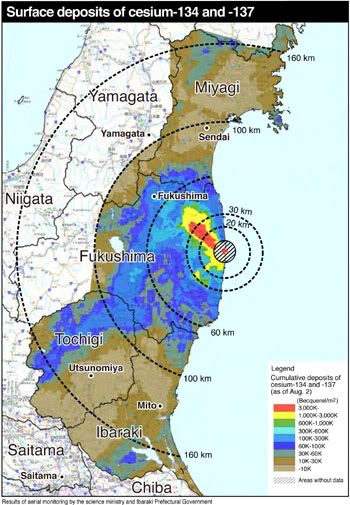
The color-coded map shows the magnitude of the fallout of cesium-134 and cesium-137, two major radioisotopes released after the severe nuclear reactor accidents at Fukushima Dai-ichi NPS in March last year. The deposits were mapped at the beginning of August, 2011. Radii are superimposed for orientation. Note, the plume's impression in red and yellow (source: MEXT).

Local wind and precipitation mainly dictate the shape of the plume in which the radioactivity is transported and disperses. To provide an example the color-coded radiation map above shows the overland plume-shaped radioactivity dispersal reconstructed with computer models from radiation monitor recordings after last year's severe accidents at Fukushima Dai-ichi NPS.

Average prevalence of wind directions at Louisa County Airport, Virginia, compiled from data collected between 1999 and 2011 (source: weatherspark.com).

In a hypothetical release at North Anna NPS resembling that of Fukushima, local weather conditions could produce a similar plume heading in a different direction. Wind speed and direction recorded at Louisa County Airport (see above) a few miles from North Anna NPS suggest that prevalent local winds blow on average from South/Southwest to North/Northeast. The plume would most likely progress toward Northern Virginia. Dispersal to the South toward the Richmond Metropolitan Area represents the second most probable direction.

The distance over which the plume eventually extends depends on the amounts of radioactivity released, the altitude of the release, wind speeds affecting the release, and precipitation. In Japan, the plume barely impacted Fukushima City, 35 miles from the nuclear reactor accidents. Note, however, that prevailing winds blew much of the airborne radioactive material out to sea.
Dominion's proposed emergency plan is most concerned with immediate impact after a severe radiological emergency. The long-term evolution of a wide-spread radioactive contamination can only be extrapolated from experiences after the Tchernobyl reactor disaster in 1986 and the ongoing contamination and clean-up around Fukushima Dai-ichi NPS. Regardless of the uncertainties, it seems only prudent to consult our local Radiological Emergency Plan, if we live within the 50-mile ingestion zone around a nuclear power station.

Acknowledgement
I thank the members of the simplyinfo.org discussion group for their cogent input, without which this post would not have been possible.

Relevant Sources

Friday, April 13, 2012

The Value of RadNet Ionizing Radiation Detection

In this post, I discuss uses of ionizing radiation measurements made available to the public by the U.S. Environmental Protection Agency's RadNet stations. In particular, I examine the usefulness of RadNet data for the early detection of radioactive fallout from distant radiological emergencies. As example, I use the reactor accidents at the Fukushima Daiichi Nuclear Power Station in the wake of the Mar. 11, 2011, Tōhoku-chihō Taiheiyō Oki Earthquake and Tsunami.

Iodine-131 and cesium-137 are prominent radioisotopes released after severe nuclear reactor accidents with fuel meltdowns. The decay of these isotopes produces a mix of beta and gamma radiation. The gamma radiation is emitted when the atomic nuclei transmute through intermittent energy states at isotope-specific energies.
Near-real time air filter gamma gross count rates measured in nine energy ranges at the RadNet station in Harrisonburg, Virginia (courtesy EPA). Because of the disparate values, the count rates are scaled logarithmically on the ordinate, compressing the peaks at high count rates. 
I used air filter measurements from the RadNet station in Harrisonburg, Virginia. The EPA publishes graphs of hourly gamma radiation gross count rates in nine energy ranges (see graph above).

Gamma spectrum of iodine-131 (Arena, 1971). Counts/channel are plotted on a logarithmic scale versus energy [keV]. Peaks are labelled in MeV.
Iodine-131 with a physical half-life of 8.05 days and an effective half-life in the whole body of 7.6 days possesses its greatest energy peak at 360 keV, a second-ranking peak at 280 keV, a third peak at 638 keV and a fourth peak at 724 keV (Arena, 1971). The lower couple fall into range 3 (200-400 keV) , whereas the higher couple fall into range 5 (600-800 keV) in the RadNet graph.

Gamma spectrum of cesium-137 (Arena, 1971). Counts/channel are plotted on a logarithmic scale versus energy [keV]. Peaks are labelled in MeV
By contrast, cesium-137 with a physical half-life of 30.17 years and an effective half-life in the whole body of 70 days emits gamma radiation at 662 keV, falling into range 5 of the RadNet graph. However, backscatter (Compton effect), that is low-energy detector counts produced by incomplete energy transfer between the ionizing radiation and the detector material, contributes a considerable fraction of the total count rate to range 3. Although the precise shape of the spectral curves shown above depends on the radioactivity of the sources and the instruments used for the measurement, the energy peaks remain invariable and representative. Therefore, the spectra may can be employed for the demonstration of principles.

Partial integration of the areas under the spectral curves taking the logarithmic scale of the counts/channel into account suggests that the iodine-131 decay contributes about 91 percent of the total count rate summed over both ranges to range 3, whereas cesium-137 decay will contribute about one third to this range. Therefore, if both isotopes are present in the sample, the count rate measured in range 3 does not exclusively reflect iodine-131 decay, and iodine-131 will also contribute to the count rate measured in range 5, though to a smaller degree than cesium-137. Despite this cross-contamination, a prominent increase in range 3 suggests the presence of iodine-131 and in range 5 that of cesium-137. Furthermore, the EPA provides offline post-hoc data for identified radioisotopes.

Regardless of its low spectral resolution, the real-time RadNet graph may potentially have its uses for the identification of a radiological incident. An increase above the average counts per minute (CPM) measured in ranges 3 and 5 beyond three standard errors of the mean can be considered statistically significant with 95 percent confidence. Mean count rates measured in the past can be queried in the RadNet database. Sequences of up to 400 measurements can be downloaded in a batch.

To determine mean count rates for the two energy ranges of interest, that is ranges 3 and 5, I chose the period between Feb. 22 and Mar. 10, 2011, and subsequently compared the means averaged over this epoch to the count rates observed in the same epoch this years. Radioactive decay adheres to the Poisson distribution in which the standard error is equal to the square root of the mean count rate. If the current count rate exceeds the mean by three standard errors, the probability of the increase being random is less than five percent.
Graph of gamma gross count rates measured in nine energy ranges taken from air filter samples at the RadNet Station in Harrisonburg, Virginia. The bottom lines of the red boxes indicate three standard errors above the mean count rate of the same epoch a year ago.
The graph above shows that this year's count rates statistically significantly exceeded the mean in the examined time window on roughly a handful of occasions. However, most comprise all energy ranges except 9 (magenta). If increases were only detected in range 3 (blue), we would most likely be confronted with a statistically significant presence of iodine-131. By contrast, a statistically significant increase in ranges 3 (blue) and 5 (yellow) would most likely indicate the presence of cesium-137.

Concomitant increases in gross beta count rates would further affirm the conclusions above, because both radioisotopes also emit beta radiation. Note, however, that the above assertions are purely based on statistical probability and causal inference. Great care must be taken to establish reasonable cause.

Iodine-131 and cesium-137 can be distinguished with time, using the difference in physical half-life between the two isotopes. Iodine-131's half-life is at 8.05 days considerably shorter than that of cesium-137 at 30.17 years. Following a pulse release of both isotopes into the atmosphere, iodine-131 should mainly contribute to the count rates measured early after the release. When the samples are remeasured ten half-lives later, that is after 80 days, the contribution of iodine-131 to the count rate will have diminished to one-thousandth. By contrast, the contribution of cesium-137 with its 30-year half-life is going to persist. Therefore, if repeated measurements of the same sample ascertain a decline in count rate commensurate with iodine-131's half-life, the radioisotope was present in the sample, and the remainder ought to be cesium-137.

Though the RadNet measurements may not immediately lend themselves to the distinction between iodine-131 and cesium-137, they may prove useful for the detection of radioactive fallout from a distant radiological accident. To test this idea, I tapped into the data collected at Harrisonburg in the weeks after the catastrophic nuclear reactor failures at the Fukushima Daiichi Nuclear Power Station situated on the shores of the Pacific Ocean 160 miles north of Tokyo in early March last year, that is between Mar. 12 and Mar. 28, 2011.

The station's reactors incurred loss of cooling in the wake of a magnitude-9 earthquake on Mar. 11, 2011, followed by 15-meter high tsunami waves inundating the structures (TEPCO press release with the title "Analysis and evaluation of the operation record and accident record of Fukushima Daiichi Nuclear Power Station at the time of Tohoku-Chihou-Taiheiyou-Oki-Earthquake," dated May 23, 2011). The nuclear fuel in three operating reactors melted down, producing great amounts of hydrogen. Between Mar. 12 and Mar. 15, hydrogen that had accumulated in the reactor buildings triggered massive explosions devastating the top floors of the structures and releasing vast amounts of radioactive matter into the atmosphere.

The first unit, Unit 1, exploded in the early afternoon of Mar. 12. The second unit, Unit 3, exploded two days later, and the third unit, Unit 4, though it was shutdown for inspection at the time, incurred an explosion in the early morning of Mar. 15. The reactor building of Unit 2, which was operating, suffered minor visible damage. However, since Unit 2's fuel melted, radioactivity was released from this reactor as well.

 Gross count rates from air filter samples collected at Harrisonburg, Virginia, over roughly two weeks after the first radioactive release from Fukushima.
Iodine-131 and cesium-137 were prominent in the airborne releases from the damaged reactors. The graph above depicts the gamma gross count rates collected in nine energy ranges at Harrisonburg over roughly two weeks after the first radioactive release from Fukushima, the statistical significance thresholds (dashed black lines) in ranges 3 (dark blue line) and 5 (yellow line), as well as the gross beta count rate (dashed red line). Peaks of significant gamma gross rate increases are evident in almost all energy ranges. None was confined exclusively to ranges 3 and 5. The light-blue line above the abscissa indicates the period in which the Fukushima Daiichi Nuclear Power Station incurred hydrogen explosions.

March 14 was the first day after the Fukushima Daiichi Nuclear Power Station began to release vast amounts of radioactivity, on which Harrisonburg registered significant peaks in gamma ranges 3 and 5 concomitant with an increase in beta gross count rate (dashed red line). A second such coincidence followed on Mar. 15. Then a triplet of coincident peaks followed on March 17, 19 and 20 (light blue dots above the abscissa). Because the peaks are spaced in about the same time intervals as the three hydrogen explosions at the Fukushima Daiichi Nuclear Power Station, this triplet of peaks represents the most probable harbinger of the arrival of fallout from Fukushima in Virginia, suggesting that radioactive airborne particulate from Fukushima reached Harrisonburg in five days.

The suggested time of arrival is a day ahead of that predicted by the cesium-137 dispersion model of Winiarek and others (2011) at the Centre d'Enseignement et de Recherche en Environnement Atmosphérique (CEREA), Marne la Vallée, France, and two days in advance of that of the iodine-131 dispersion modeled by Wotawa (2011) at the Zentralanstalt für Meteorologie und Geodynamik (ZAMG), Vienna, Austria.

Global iodine-131 dispersion after the Fukushima reactor accidents, 2011, according to the simulation model by Wotawa (2011), ZAMG, Vienna, Austria. 

Taking the above findings together, RadNet air filter count rate measurements seem to provide superb sensitivity for the detection of minute traces of airborne radioactive material, permitting us to identify distant radiological accidents half ways around the globe, if examined in proper factual context. Certainly, RadNet stations represent potent tools capable of alerting us to fallout from radiological accidents closer to home.

References