I worked with radioactive isotopes known as radionuclides in laboratory research for almost three decades in my professional career. Since three reactor fuel cores melted down at the Fukushima Dai-ichi (number one) Nuclear Power Station (NPS) owned by
Tokyo Electric Power Company (TEPCO) in the aftermath of the
Tohoku-Chihou-Taiheiyou-Oki Earthquake and Tsunami on March 11, 2011 [1], I have been concerned about the safety of nuclear power reactors.
At magnitude M
w 9.0 (I
JMA 7.0 on the
Japan Meteorological Agency intensity scale), this earthquake was the strongest recorded in Japan's history, causing massive damage. Moreover, tsunami waves up to 40 meters high inflicted horrible devastation on the coast. The Government of Japan reports that 15,687 people lost their lives and 4,757 are still missing as of Aug. 9, 2011 [2].
The quake and tsunami caused a total station blackout at Fukushima Dai-ichi NPS. Reactor fuel core cooling could not be maintained, the fuel began to melt, and radioactive material could not be contained. After powerful hydrogen explosions, still unknown amounts of radioactive material were released into the air and the sea. Roughly 80,000 people living in immediate proximity of the power station were evacuated and have not been able to return home, except for brief visits [2]. Soil and sea near the NPS are highly contaminated with radioactive material. Long-lived radionuclides have been found in foods like rice [3] and beef [4] at levels too high for consumption. Hotspots of radiation are being discovered in Tokyo and further away [5]. The impact on public health is not yet fully comprehended. The costs of this crisis and its long-term consequences are unfathomable, but will be in the hundreds of billion yen.
 |
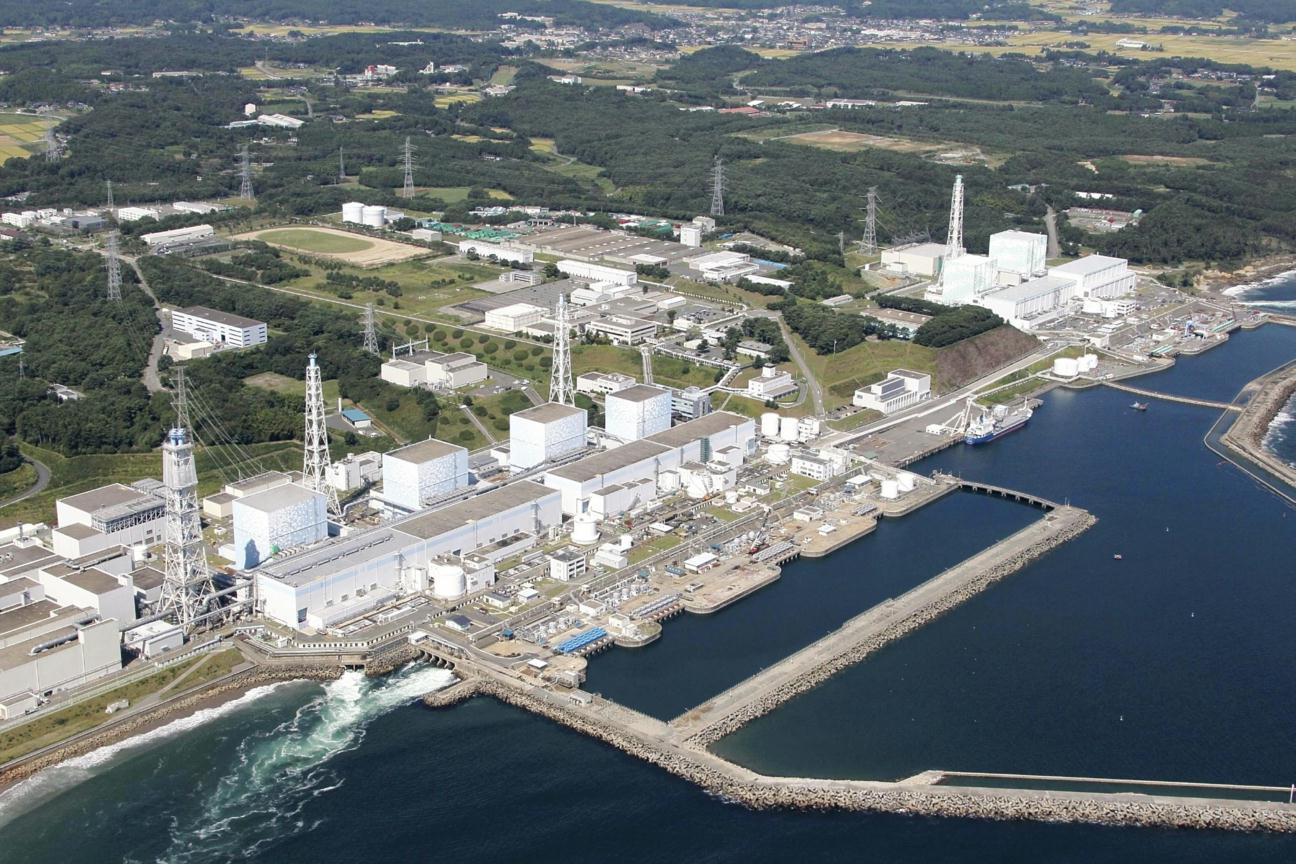
Aerial photograph of Fukushima 1 (Dai-ichi) NPS taken March 24, 2011. Note the obliteration of the reactor buildings at Units 1 (top), 3 and 4. Fuel cores melted in Units 1, 2 and 3 because of loss of coolant. Unit 4 was shutdown for service at the time of the earthquake and tsunami (source: cryptome.org).
The islands of Japan lie in a seismically active zone near the
Pacific Rim of Fire. They are situated in close proximity to the
Japan Trench in the Pacific Ocean off Japan's northeast coast where two tectonic plates violently collide. No doubt Japanese engineers have collected in-depth theoretical and empirical knowledge on the effects of seismic waves on industrial systems, structures and components, particularly in nuclear engineering.
All nuclear power stations in Japan are equipped with seismometers that record ground motion in the three spatial dimensions and automatically
scram nuclear reactors at predetermined set-points.
Aerial photograph of Kashiwasaki-Kariwa NPS. Older Units 1 (bottom, right) to 4 (top) are in the foreground. The most recently built Units 5 to 7 are in the background (top, left) (source: TEPCO).
Kashiwasaki-Kariwa NPS
As recently as Jul. 16, 2007, a M
w 6.6-magnitude (I
JMA 6.8) earthquake known as the
Niigata-ken Chuetsu-Oki Earthquake, or NCO Earthquake for short, struck
Kashiwazaki-Kariwa Nuclear Power Station (KK) on Japan's northwest coast. The NPS, with seven reactors and 8.2 Gigawatt electrical power output the world's largest, is owned by the same utility as Fukushima Dai-ichi NPS, that is TEPCO. The quake automatically tripped the four reactors operating that day.
Kayen and others (2007) [6] examined the geotectal causes for the quake in great detail and compiled a comprehensive account on land failure and the damage to infrastructure in the region. I have explained fundamental wave concepts underlying earthquakes in the context of the
Great Haiti Earthquake of Jan. 12, 2010, in my post with the title "
Neuroanatomy of an Earthquake" published Jan. 18 of that year. In this essay, I shall attempt to explain in more detail measurements of ground motion, projections of observations, and their relationship with quake damage at nuclear power stations.
Ground Motion Acceleration Units, Dimensions, and Conversions
1 Gal (Galileo) = 1 cm/s2
1 g (fraction of gravitational acceleration) = 980 Gal
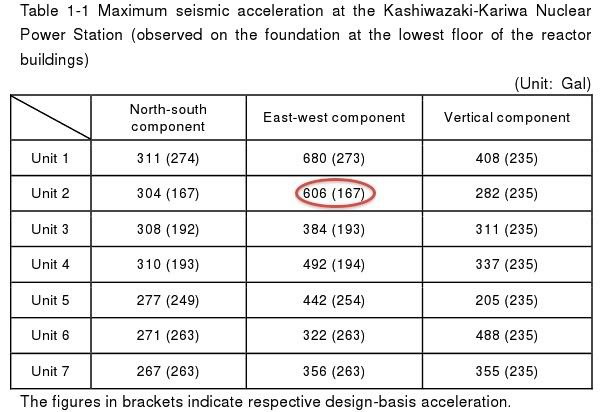
At Kashiwasaki-Kariwa NPS, operators were able to recover recordings of ground motion from only one third of roughly 100 recording locations [7]. Fortunately, recordings could be retrieved from the bottom floors of the seven reactor buildings, known as base mats.
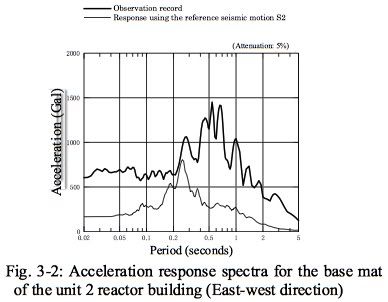
As typical examples, the accelerogram for the east-west ground motion recorded on the base mat of Kashiwasaki-Kariwa NPS Unit 2 is shown below as well as the observed acceleration response spectrum (thick line) and the design-basis acceleration response spectrum (S2, thin line) for the same location. The latter is computed, using synthesized time histories of past earthquakes.
TEPCO [8]
Peak ground acceleration (
PGA) on the reactor building base mats exceeded the design basis for all seven units. The greatest PGA was recorded at Kashiwasaki-Kariwa NPS Unit 1. The worst exceedance was 3.6-times design basis at Kashiwasaki-Kariwa NPS Unit 2 [8]. Note 5% damping is assumed in the calculations, because the structures absorb quake energy [9].
TEPCO [8]
The trip points for automatic reactor shutdown known as
SCRAM were set at 100 Gal (0.10 g) in the horizontal directions and at 120 Gal (0.12 g) in the vertical direction [10]. The quake caused a massive switch yard transformer fire. Radioactive gaseous effluent was released into the atmosphere because of a malfunction of the HVAC system. The amount was deemed small enough not to pose a threat to the public.
Visual inspections were carried out during extensive post-quake walkdowns, as well as pressure and function tests, on about 20,600 components, instruments, panels and valves, and 155,000 meters of pipe [10]. Nuclear power station systems, structures and components (
SSC) are classified in three groups of importance for seismic safety. SSCs in the most important group did not appear to have incurred any damage at Kashiwasaki-Kariwa NPS. This group is known as class A in Japan and seismic design category I, or SDC-I for short, in the US (
Antaki and Johnson, 2011) [11]. Damage, deformation, and impeded function were uncovered only on class B (SDC-II) and C (SDC-III) systems, structures and components deemed unimportant to reactor safety.
Using advanced ultrasonic technology, inspectors detected some
hidden damage. For example, cracks were found in the rotor shaft and blades of power-generating low pressure main steam turbines. TEPCO concluded that this damage was a result of fatigue rather than the quake.
All SSCs at which damage was discovered were repaired. Because of the broad exceedance of the design basis earthquake at the seven units, additional safeguards were installed, and new spectra were computed to ensure that the implemented measures strengthened the design basis.
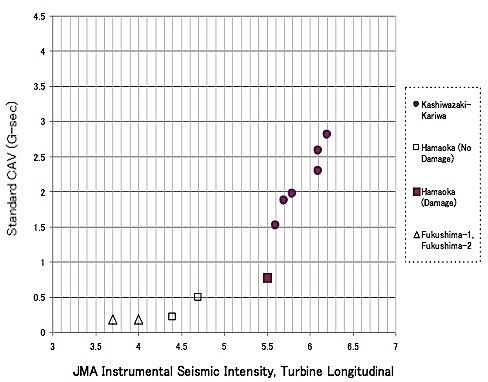
The apparent disassociation between earthquake magnitude, observed peak ground acceleration and damage led to the search for new indicators better predicting quake damage. Apparently, the currently used measurements of magnitude and ground motion do not adequately appreciate the temblor's duration. To remedy this shortcoming, cumulative absolute velocity expressed in cm/s or g-sec,
CAV for short, was introduced. CAV constitutes the sum of the ground accelerations added over the duration of the quake. Standardized cumulative absolute velocities are filtered for non-damaging ground motion frequencies.
Standardized cumulative absolute velocities [g-sec] are plotted against the magnitude of quakes that shook nuclear power stations in Japan before 2011. Magnitude is expressed as seismic intensity on the IJMA scale used by the Japan Meteorological Agency (JMA). Historically, trained JMA agents qualitatively scored quake magnitude. Today, instruments register quake intensity automatically. Damage was detected at main turbines, that is SSCs unimportant to reactor safety. The data suggest a damage threshold for such SSCs at CAV 0.8 g-sec and IJMA 5.5 [12]. The lowest PGA the JMA allows at this intensity is 0.25 g.
No quake damage is anticipated for PGAs below 0.25 g.
Foreshadowing the reactor catastrophe at Fukushima, however, in tests during the restart of Kashiwasaki-Kariwa Unit 7 in May 2009
the Reactor Core Isolation Cooling system, or RCIC for short, did not perform as expected because of valve failure. RCIC steam entered a pressure control chamber at the bottom of the reactor pressure vessel, and the cooling water in the chamber rose. Operators had to intervene. At Fukushima Dai-ichi NPS, the RCIC systems of the two operating reactors outfitted with this system would fail last March, profoundly impeding the operator's efforts of preventing the reactor fuel cores from melting down. I have described the weaknesses of the RCIC system in detail in my post with the title "
Fukushima: Failure by Design" published Jul. 3, 2011.
TEPCO [13]
Fukushima Dai-ichi NPS
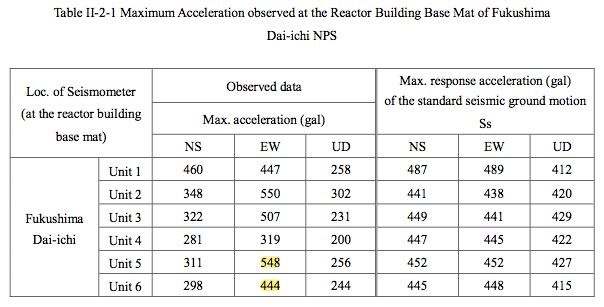
TEPCO insists that the reactor fuel core meltdowns at Fukushima Dai-ichi NPS were precipitated by the total station blackout caused by the loss of emergency diesel power through tsunami inundation [13]. The company has given seismic impact as cause little credence. TEPCO's interpretation is supported by the ground motion recorded on the base mats of the reactor buildings. Though PGAs broadly exceeded design basis in the horizontal east-west direction at Fukushima Dai-ichi NPS, the greatest exceedance was roughly a third of that found at Kashiwasaki-Kariwa NPS after the NCO Earthquake, that is the greatest exceedance was only 1.26-fold at Unit 2. CAV values have not yet been released.
 |
Aerial photograph of Fukushima 1 (Dai-ichi) NPS taken Sep. 18, 2010. Units 4 (left) to 1 (right) were built in a row. Unit 1 closest to the water front is the oldest commercial nuclear power reactor of Japan completed in 1971. Units 5 and 6, set apart on the upper right, are the youngest reactors at the station (source: cryptome.org).
Of the six reactors at Fukushima Dai-ichi NPS, units 5 and 6 were least affected by the tsunami and exhibited the smallest PGA exceedance [13]. They were disconnected from the power grid when the quake struck, undergoing tests fully loaded with fuel. Combined with the findings at Kashiwasaki-Kariwa NPS after the NCO Earthquake, the seismic impact uncovered at these units may provide valuable lessons for predictions of future quake damage at nuclear power stations.
In fact, the lessons learned from both quakes in Japan stipulate that ground motion in exceedance of the design basis may impact nuclear power station systems, structures and components (SSC) in subtle ways. Although quake damage may mainly be detected on less quake-resistant SSC categorized B (SBC-II) and C (SBC-III), the subtleties warrant in-depth inspections for potential
hidden damage of all SCC, regardless of class.
North Anna NPS
On Aug. 23, 2011, the Northeastern Seaboard of the U.S. was struck by a magnitude M
w 5.9 earthquake centered near Mineral, Virginia, in the Central Virginia Seismic Zone close to the
North Anna Nuclear Power Station with two pressurized water reactors.
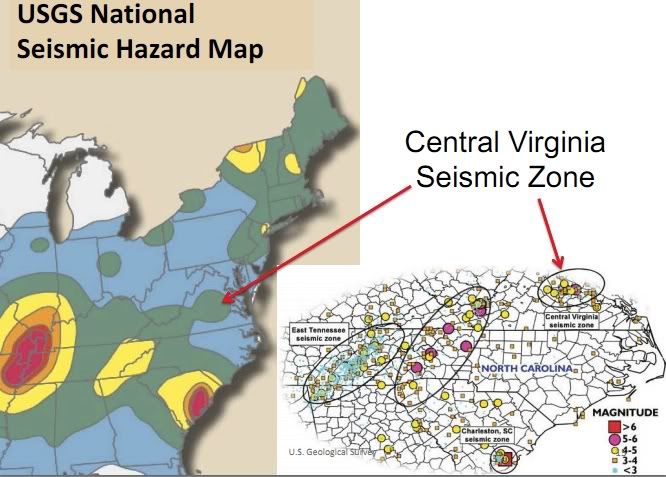 |
| USGS [14] |
Both reactors were shut down safely. The quake was felt as far as Boston, Massachusetts [15]. By and large minor damage was found at monuments, as well as governmental, residential and commercial buildings, extending over a surprisingly large area. This Washington Post picture gallery with the title "
Magnitude-5.8 earthquake shakes D.C." provides a sweeping impression of the quake's impact.
The damage, combined with subjective experience, matches the criteria of a six-lower (6
弱) magnitude quake on the Japan Meteorological Agency (JMA)
shindo scale, pegging the quake's PGA between 0.250 g and 0.315 g. In accord, the United States Geological Service (USGS) estimates 0.26 g [14].
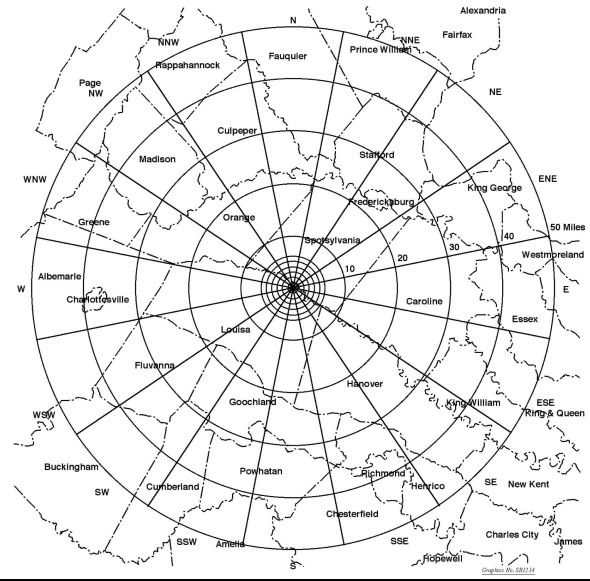
According to the findings in Japan discussed above, this peak ground acceleration merely touches the threshold at which damage to systems, structures and components must be expected at nuclear power stations. Based on observations after the
1995 South Hyogo Prefecture Earthquake, also known as the Kobe Earthquake,
Ochiai and others (2010)[12] suggest that the potential damage at nuclear power plants with ground shaking of the magnitude of the Virginia quake may comprise: falling air ducts, tumble (with weak anchorage), failure of foundation anchorage, circular storage tank wall buckling (elephant foot), contact/hitting of pipes (insulation and grating damage), and buckling of crane basements. On occasion, pulling out/fracture of anchor bolts, overflow (sloshing), pipe support structure damage (pulling out of anchor bolts), and failure of transmission line support may be observed [12].
North Anna NPS is the first nuclear power station in the Central Eastern United States (CEUS) at which reactors scrammed because of a seismic event. The reactors at North Anna NPS lack automatic seismic scram systems. The reasons for the scrams are not yet fully understood. Offsite power was lost because of ground motion. Emergency diesel generators started up. The ensuing power fluctuations may have tripped the reactors. Seismic recordings were obtained from the Unit 1 reactor containment base mat as well as the turbine buildings and sent out for evaluation in the days after the incident by the station's operator,
(Dominion) Virginia Electrical and Power Company, or VEPCO for short. In addition, VEPCO immediately carried out walkdowns, visually inspecting the station's systems, structures and components (SSC) for damage. Operability and performance was examined extensively. Underground piping was unearthed, checked, and pressure-tested. Welds were examined with ultrasonic devices.
In public meetings at Nuclear Regulatory Commission (NRC) headquarters near Washington, D.C., on Sep. 8 and Oct. 21, 2011, VEPCO reported preliminary findings. VEPCO is determined to restart the reactors as soon as the inspections are completed, and the NRC approved the results.
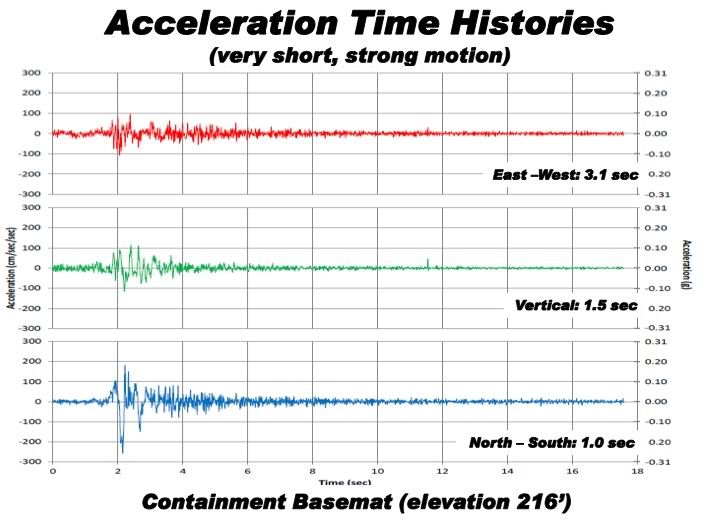
At the Oct. 21 meeting, VEPCO presented accelerograms retrieved from the reactor building base mat of North Anna NPS Unit 1. Note the short duration of the quake. The figure below as well as other North Anna NPS data shown in this post were released for the two NRC meetings.
Accelerograms showing ground motion on the base mat of the North Anna NPS Unit 1 reactor building in the three spatial directions (left ordinate: acceleration [Gal]; right ordinate: [g], abscissa: time [s]). Note the ground motion at the NPS lasted only 3.1 seconds (VEPCO, Oct. 21, 2011).
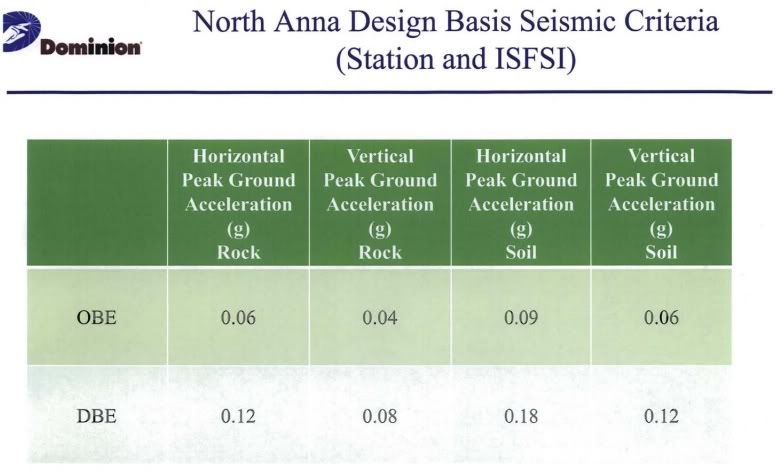
In addition, VEPCO provided the peak ground accelerations (PGA) the company used to calculate the design basis spectra for North Anna NPS.
Stipulated peak ground acceleration limits for rock (reactor building foundation) and soil (foundation of turbine buildings and ancillary structures) by ground motion direction for Operating Basis Earthquake and Design Basis Earthquake (VEPCO, Sep. 9, 2011).
The stipulated PGAs vary for ground motion direction and ground type, that is rock and soil on which the reactor buildings and ancillary structures are built, respectively. According to
Antaki and Johnson (2011)[11], NPS systems, structures and components are designed to withstand ground motion based on the operation basis earthquake, or
OBE for short, which is anchored at half the PGA used to determine the Safe Shutdown Earthquake (
SSE), that is at the ground motion at which the reactors are to be shut down to protect their safety. By contrast, the design basis earthquake, or
DBE for short, is calculated to envelope the expected ground motion envisaged at 80 percent of the NPS sites in the Central and Eastern U.S., assuming an OBE equal to one-third or less of the SSE. Dependent on NPS location, the PGA used to determine the SSE is set between 0.1 g and 0.3 g, which is equal to or higher than the trip points for automatic seismic scram systems used at Japanese nuclear reactors. In sum, the reactors are supposed to be shut down at peak ground accelerations much below DBE. However, note that the greatest anticipated DBE at North Anna NPS is 0.18 g, which is below the USGS estimate for the Virginia quake. Therefore, it is not surprising that recorded peak ground motions were greater than assumed in the DBE.

|
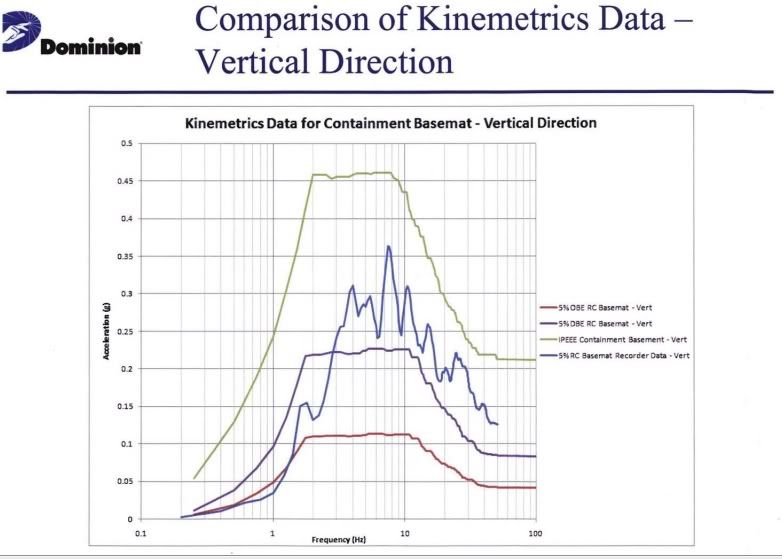
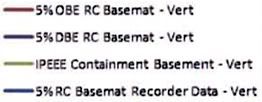
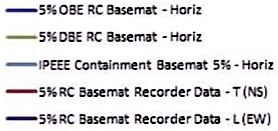
Recorded (ondulating curves) and computed (smooth curves) seismic response spectra at 5 % percent damping for the vertical (top) and horizontal (bottom) directions at North Anna NPS Unit 1 reactor building base mat (ordinate: acceleration [g]; abscissa: frequency [Hz]). The bottom and middle smooth curves in each graph describe OBE and DBE, respectively. Note that the recorded ground motion exceeded DBE at frequencies greater than 1.0 Hz in the vertical as well as in the north-south direction, and greater than 10.0 Hz in the east-west direction (VEPCO, Sep. 9, 2011).
The two graphs above show the seismic response spectra constructed from the data VEPCO recovered from the base mat seismometers of the North Anna NPS Unit 1 reactor building. Clearly, PGA exceeded DBE at frequencies greater than one Hertz. Damage was to be expected at class B and C systems, structures, and components, that is SSCs unimportant for reactor safety.
However, VEPCO reasoned that the anticipated damage might not have been detrimental to the safety of North Anna NPS, because quake duration and DBE exceedance were short in comparison with other known damaging quakes. The operator reasoned that cumulative absolute velocity (
CAV), which takes the duration of the quake into account, represents a more accurate damage predictor than PGA, as discussed in context with the NCO Earthquake and the Tohoku Earthquake. VEPCO therefore presented standardized CAV values at the NRC meetings.
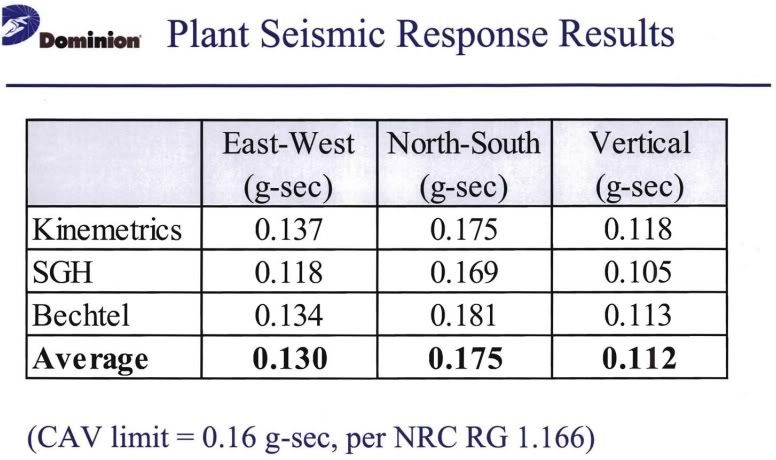
Standardized cumulative absolute velocities [g-sec] calculated by three expert companies from the accelerations detected on the base mat of North Anna NPS Unit 1's reactor building for ground motion in the three spatial directions. Note that north-south direction motion exceeded the NRC prescribed limit of 0.16 g-sec below which a nuclear power reactor can be operated safely (VEPCO, Sep. 9, 2011).
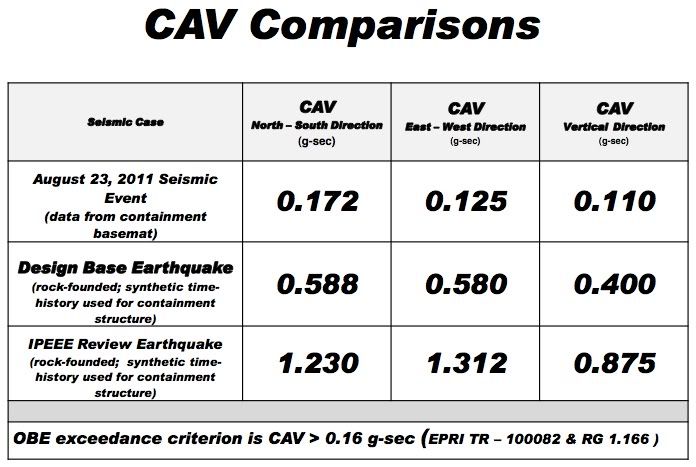
Standardized cumulative absolute velocities [g-sec] calculated from recordings and modeled for the three spatial directions of motion on the North Anna NPS Unit 1 reactor building base mat. The observed velocities did not exceed the modeled design base earthquake (DBE) and the limits modeled in the Individual Plant Examination for External Events (IPEEE) (VEPCO, Oct. 20, 2011).
The standardized cumulative absolute velocities determined for recorded north-south ground motion on the base mat of North Anna NPS Unit 1 reactor building exceeded OBE, necessitating the shutdown of both units. Yet, the values remained below the cumulative absolute velocities calculated for DBE, as well as the higher limits calculated in the Individual Plant Examination for External Events (IPEEE) stipulated by the NRC. The IPEEE, but not the DBE values, are above 0.8 g-sec, that is the CAV threshold for quake damage at nuclear power stations in Japan, according to the CAV/quake magnitude plot of
Ochiaia and others (2011)[12]. The authors note only one incident with damage that occurred at a CAV below 1.5 g-sec. Main steam turbine damage was detected at Hamaoka NPS Unit 5 after the Aug. 11, 2009,
Shizuoka Earthquake, which scrammed the station's units 5 and 6.
By contrast, the greatest recording-based CAV at Kashiwasaki-Kariwa NPS reached 2.8 g-sec, 16-times the highest CAV at North Anna NPS. For ground motion predictions,
Campbell and Bozorgnia (2011) plotted the standardized cumulative absolute velocity against
IJMA, that is the quake intensity the Japan Meteorological Agency (JMA) uses (Fig. 4.1) [16]. The plot shows a close direct proportionality between the logarithm of cumulative absolute velocity and the JMA quake intensity scale. VEPCO's cumulative absolute velocities for recorded ground motion fall short of the range between 0.3 and 2.0 g-sec (median = 1.2 g-sec) that the plot predicts for the Virginia quake, though the qualitative descriptions of the damage and the quake experience in the region closely match the ones provided by JMA for a quake of this magnitude. Therefore, VEPCO's cumulative absolute velocities may underrate the possible extent of the damage.
North Anna NPS lost offside power because of a disruption in the switchyard, necessitating the startup of emergency diesel generators. This event arguably represents the most consequential impact of the Virginia quake on the NPS known to date. So far, the station inspection uncovered minor damage to SDC-II and SDC-III systems, structures, and components unimportant to reactor safety. Intriguingly, the inspectors noted quake impact similar to that found at Fukushima Dai-ichi Units 5 and 6, though the recorded peak ground acceleration at North Anna NPS was only roughly half of that observed at these units and, according to the
Japan Meteorological Agency, the quake reached six-upper (6強) on the shindo scale in the region with seismic intensities I
JMA between 6.0 and 6.4. By contrast, the Virginia Earthquake qualifies for six-lower (6弱).
As examples for similar quake impact at Fukushima Dai-ichi and North Anna nuclear power stations, two types of visible damage are explored below:
Component Relocation: At Fukushima Dai-ichi Unit 5's turbine building, a support for the moisture separator drain pipe shifted,
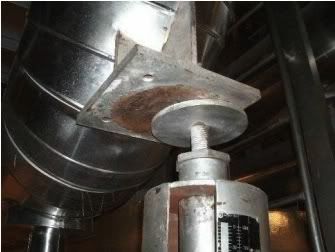 |
| Moisture separator drain pipe support moved in Fukushima Dai-ichi Unit 5 turbine building (TEPCO). |
while at North Anna, 25 of 27 spent fuel dry storage casks shifted.
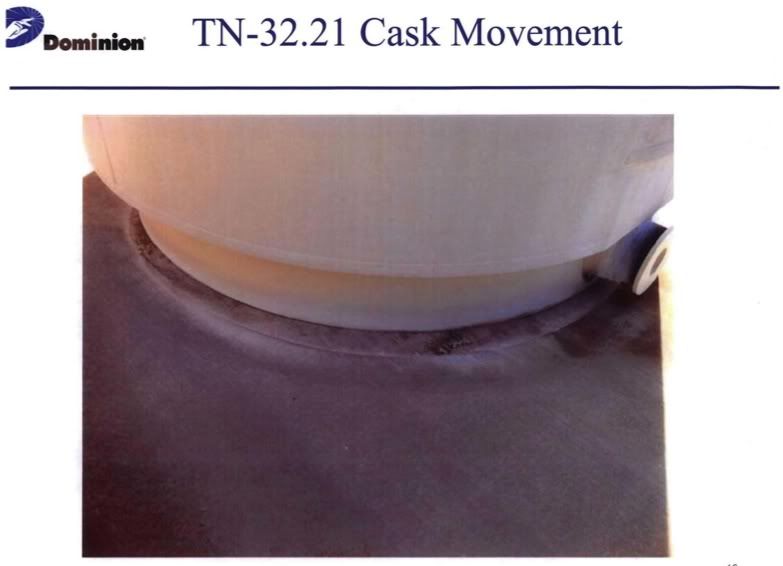 |
| Dry casks for spent fuel moved at North Anna NPS storage area (VEPCO). |
Concrete damage: At Fukushima Dai-ichi Unit 6's turbine building, the concrete pedestal of the feedwater heater chipped at the edges,
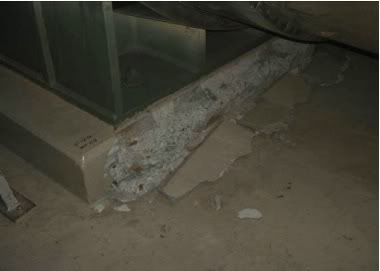 |
| Fukushima Dai-ichi Unit 6 concrete pedestal chipping at feedwater heater in the turbine building (TEPCO). |
while at North Anna the concrete pedestal of a demineralizer chipped at the edges.
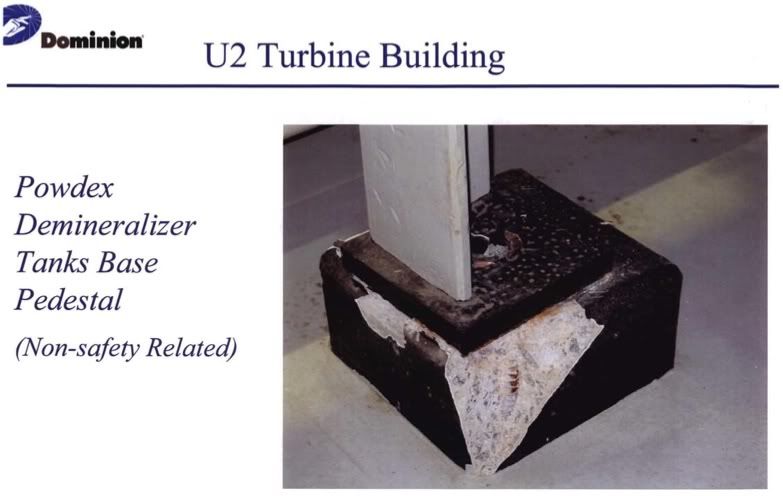 |
| North Anna NPS turbine building chipping of concrete base for demineralizer (VEPCO). |
These similarities suggest that it may be imprudent to underestimate the possibility of damage to North Anna NPS comparable to that observed at nuclear power stations in Japan after a 6-upper quake, because of similar differences between ground motion anticipated in design and ground motion actually occurring. Notably, differences in ground motion between the reactors built on rock and ancillary structures and components built on soil may exacerbate quake impact on their connections.
Outlook
Learning lessons from the Japanese experience, three areas of focus important to safety at North Anna Nuclear Power Station emerge:
- Seismic risk reduction through automatic seismic scram
Only few commercial nuclear power stations in the U.S. are outfitted with the equipment needed to automatically scram the reactors when they are subjected to ground motion reaching stipulated setpoints. The Sep. 8, 2011, meeting revealed that the control room operators at North Anna NPS lacked information on containment motion when they needed it most. At the instant of the quake, seismic instruments had lost power. The alarms that would have informed the operators whether the ground motion warranted a shutdown failed. On Sep. 28, VEPCO informed the NRC that negative power flux rates at the station caused the scrams. The precise cause of the of the negative flux rates remains to be resolved. Automatic seismic scram systems may have benefitted the operators in shutting down the station's two reactors more expediently. VEPCO should be asked to evaluate whether state-of-the-art automated seismic scram systems would reduce current levels of seismic risk. Moreover, it seems prudent to independently retrofit all seismically important instrumentation separately with 24 hour-lived batteries. Additional, solar power may extend battery life.
- Seismic risk re-evalution of the ultimate heat sink
The reactor core decay heat persisting after a scram must be transferred to the ultimate heat sink. For example, North Anna NPS uses Lake Anna, a dammed lake created for the purpose, as ultimate heat sink. The heat transfer to the ultimate sink is crucial to cooling the reactors, preventing fuel core meltdowns with disastrous consequences as the reactor accidents at Fukushima 1 NPS last March strikingly demonstrate. The preservation of the ultimate heat sink and its use via residual heat removal systems are of existential importance to reactor safety.
Lake Anna's water level had fallen two feet after the Virginia Earthquake Aug. 23, 2011 (source: WTVR CBS 6 Richmond, VA) [17].
According to CBS Channel 6 News, Richmond, VA, the water level of Lake Anna had fallen roughly two feet after the quake [17]. At the Sep. 8 meeting in Rockville, VEPCO stated that an inspection of the dam provided no evidence of quake damage. At the Oct. 21 meeting, VEPCO elaborated that Lake Anna and its main dam do not represent the ultimate heat sink for the station, but that this function is served by a smaller body of water separated from the lake by another dam. VEPCO inspected this dam and found no damage. Regardless of this barrier, the lake represents the ultimate heat sink, if only indirectly. The question what might have precipitated the reported rapid loss of water from the lake remains to be answered. Uncovering the cause for such drastic water level diminution, should it be confirmed, might be of profound importance for the seismic safety of North Anna NPS, because Lake Anna constitutes the ultimate heat sink for the decay heat of the reactor fuel cores during shutdown. According to wikipedia, earthquakes of M 4.0 and greater may trigger tsunamis in lakes. Depending on the exact ground motion and the shape and size of the lake, small transient rises on one side may be accompanied by larger drops on the other.
- Seismic risk re-evaluation of all emergency core cooling system SSC
All SSC of the emergency core cooling system, including condensate storage tanks, are important to seismic safety and should be tested structurally and functionally. Particular attention must be paid to SDC-II and III SSC built on soil that are connected with SDC-I SSC built on rock, because soil ground motion is commonly greater than rock ground motion. Differences in ground motion between rock and soil may result in damage to the connections between SSC built on either substrate. At Fukushima Dai-ichi NPS, efforts to prevent the meltdowns of the fuel cores of units 2 and 3 were rendered ineffective by the failure of reactor core isolation cooling (RCIC) systems and high pressure coolant injection (HPCI) systems. The meltdown at Unit 1 was precipitated by a failed isolation condenser (IC). Combined with the failure of the Residual Heat Removal (RHR) system primarily attributed to tsunami damage, these shortcomings contributed in no small part to the failure of the emergency core cooling system (ECCS). The inspections at North Anna NPS must ensure that all SSC of the ECCS conform to the highest seismic safety level and can withstand the ground motion the station is anticipated to incur by substantial margin.
We shall see how VEPCO's re-evaluation of North Anna NPS proceeds. Like at Kashiwasaki-Kariwa NPS Unit 7, function tests of ECCS components during restart will show whether the reactors can be operated safely. Decisive insights will be gained at the very end.
Acknowledgment
I am indebted to the numerous commenters on
scribblelive.com Japan Earthquake5 without whose up-to-date input I could not have written this post. The information on
www.simplyinfo.org was of invaluable help. I thank MJ Racer whose cogent post on
physicsforums (
comment number 10945) provided the lead for this essay.
References
- Report of Japanese Government to the IAEA Ministerial Conference on Nuclear Safety -The Accident at TEPCO’s Fukushima Nuclear Power Stations- submitted to the International Atomic Energy Agency Jun 7, 2011.
- Additional Report of Japanese Government to IAEA - Accident at TEPCO's Fukushima Nuclear Power Stations
Transmitted by Nuclear Emergency Response Headquarters, Government of Japan, 15 Sep 2011
- Kimura S (Sep 24, 2011) Cesium exceeding safety threshold detected in Fukushima rice. Asahi Shimbun, Tokyo
- NHK World News (Jul 19 ,2011) Govt bans beef cattle shipments from Fukushima. Japan Broadcasting Corporation, Tokyo.
- The Japan Times Online (Oct 12, 2011) Yokohama finds high strontium-90 levels. The Japan Times, Kyodo.
- Kayen R, Collins BD, Abrahamson N, Ashford S, Brandenberg SJ, Cluff L, Dickenson S, Johnson L, Kabeyasawa T, Kawamata Y, Koumoto H, Marubashi N, Pujol S, Steele C, Sun J, Tanaka Y, Tokimatsu K, Tsai B, Yanev P, Yashinsky M, Yousok K (2007) Investigation of the M6.6 Niigata-Chuetsu Oki, Japan, Earthquake of July 16, 2007: U.S. Geological Survey, Open File Report 2007-1365.
- Measures taken by the Nuclear and Industrial Safety Agency concerning the Kashiwazaki-Kariwa Nuclear Power Station, affected by the Niigataken Chuetsu-oki Earthquake (2nd Interim Report), June 29, 2009, Nuclear and Industrial Safety Agency.
- TEPCO Press Release (Jul 30, 2007) The (First) Report on the Analysis of Observed Seismic Data Collected in Kashiwazaki-Kariwa Nuclear Power Station on the Occasion of the Niigata-Chuetsu-Oki Earthquake in 2007. (Appendix)
- Naeim F, Kircher CA (2001) On the damping adjustment factors for earthquake response spectra. Struct Design Tall Build 10: 361–369.
- Gaku, S (2010) Experience of NCO Earthquake and Restart of Kashiwazaki-Kariwa NPP. 1st Kashiwazaki International Symposium on Seismic Safety of Nuclear Installations and Embedded Topical Meetings: C-13.
- Antaki G, Johnson J (2011) Seismic design and retrofit of essential systems in nuclear power plants. Becht Nuclear Services.
- Ochiai, K, Kobayashi K, Chigama A (2010) Damage Indicating Parameters and Damage Modes of Mechanical Components. 1st Kashiwazaki International Symposium on Seismic Safety of Nuclear Installations and Embedded Topical Meetings: C-24.
- Additional Report of Japanese Government to IAEA - Accident at TEPCO's Fukushima Nuclear Power Stations
Transmitted by Nuclear Emergency Response Headquarters, Government of Japan, 15 Sep. 2011.
- Leith W (2011) Comments on the Japan Near-Term Task Force Report.
- Joe Dwinell J, Sherman N (Aug 23 ,2011) Virginia quake shakes up Boston. The Boston Herald, Boston.
- Campbell KW, Bozorgnia Y (2010) Analysis of cumulative absolute velocity (CAV) and JMA instrumental seismic intensity (IJMA) using the PEER-NGA strong motion database. PEER 102.
- CBS 6 WTVR News (Aug. 25, 2011) Mineral residents concerned about nuclear power plant. WTVR CBS 6 Richmond.
Related Posts
Addenda
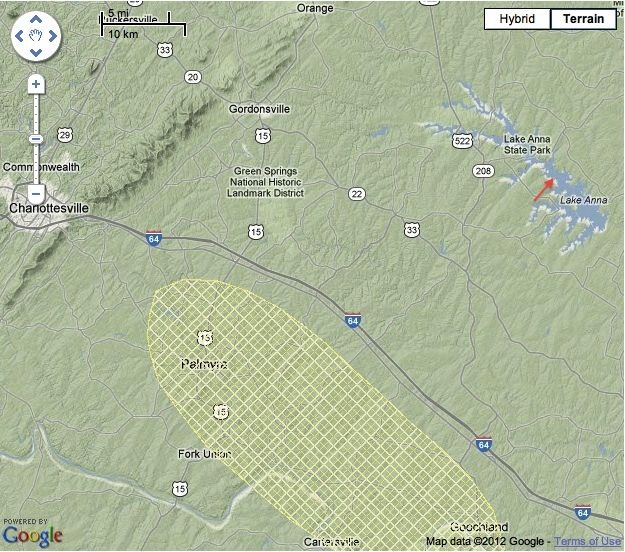
- In response to the comment to this essay, I provide a Google-maps image of North Anna NPS. Looking over the station's lay-out, I find it difficult to conceive that Lake Anna does not represent the ultimate heat sink for the station as the commenter claims. I leave the decision to the experts (06/12/2011).
 |
| Bird's eye view of North Anna NPS. Note Lake Anna and two separate small bodies of water on the premises of the station that could potentially serve as the ultimate heat sink (courtesy Google maps). |
- Listen to WVTF Radio IQ's Evening Edition for Nov. 22, 2011. There are three contributions. In the second contribution, Beverly Amsler interviews Virginia Tech seismologist James Martin about the after-effects of the Aug. 23, 2011, Virginia Earthquake. Dr. Martin's assessment suggests that it would be only prudent to retrofit all nuclear power stations on the Northeastern Seaboard with automatic seismic scram systems like nuclear power stations in Japan. The broadcast can be heard with the embedded mp3-player below (06/01/2012):
- The damage rendering the emergency core cooling systems of the reactors at Fukushima Dai-ichi NPS inoperable seems to have been mainly inflicted by flooding because of the tsunami. According to wikipedia, tsunamis do not occur in oceans alone, but can also be generated in lakes by fault displacement beneath or around the body of water, resulting in earthquakes of 4.0 magnitude or greater.


